-
Term: Histogram
Description: A histogram, in photographic terms, is a graphical representation of the different tones (image data, colors and overall brightness) that is contained in an image. Histograms are very useful to photographers in gauging the correct exposure for a given situation, based on what tonal range they wish to capture. On the LCD display of a digital camera, the brightness of the image alone is not always a reliable representation of the image's actual brightness, especially in very bright sunlight and very dark night conditions. The histogram seen on the back of the camera, since it is a numerical graph, will therefore always "tell the truth" regardless of the screen brightness or the ambient light.
Histogram
What Is A Histogram?
Believe it or not, however, histograms are incredibly simple, and also extremely useful! Whether you’re a total beginner or a working professional, having a full understanding of all your images’ histograms is very important. A true mastery can even help you work faster in the field, and be more confident that you’re getting exactly the results you want, both creatively and technically.
So, let’s demystify the histogram! This article will help you quickly understand what a histogram is, and how to interpret any histogram. (Spoiler: they’re literally a graph of all the different tones in your image.)
Next, we will talk about how creativity plays a role in a “correct” histogram, plus finally, we will include a few final technical details for any photographers who are truly geeky and wish to become a complete master of in-camera histograms.
 Maui, Hawaii – Read our Canon EOS R Review Here
Canon EOS R, Canon RF 24-105mm f/4
1/320 sec @ f/10 & ISO 100
This article is designed to be the ultimate guide to understanding histograms, and comes from our full-length course, Photography 101. However this article, and all of the education on SLR Lounge, is not designed to be a technical manual, but rather a field guide. We create real-world resources, designed to get you out and shooting as quickly as possible.
For those who are interested, we will include additional technical details and facts at the end of the article.
Let’s dive right in, and learn everything about your histogram!
How To Read A Histogram
A histogram is basically your image that has been turned into a simple graph of the different tones, from white to black, as well as all the color tones.
 Wigwam Motel, Route 66, Holbrook Arizona
Nikon D750, Nikon 24-120mm f/4 VR
1/10 sec @ f/11 & ISO 100
The left edge of the histogram is where pure black would be, while the right edge of the histogram graph is where pure white would be. In the RGB (individual red, green and blue color channels) histogram above, you can see that the image is of a firey sunrise, with lots of bright, warm colors, and a few various cooler tones in the shadows and mid-tones. And, lo and behold, the histogram reflects that! The entire right (bright) half of the histogram is almost entirely red and yellow on the graph, and then on the left (shadow) half of the histogram, there are many mixed tones with a few “bumps” of different blue tones.
So, it’s that simple. Next, as you might imagine, when you brighten your exposure, the entire histogram will shift to the right, and when you darken the exposure, the histogram will shift tothe left. Brighter, and darker. Again, super simple, right?
 Thunderbirds performing a maneuver at the Great Pacific Air Show
Sony A7iii, Sony 70-200mm f/2.8 GM – 1/1250 @ f/2.8 & ISO 100
Reading the specific details of your histogram is indeed that simple: Each “bump” on the graph represents certain tones in the image itself. This is why you’ll often see a specific, large bump in a histogram when a large part of the image is a single tone.
 In this example, the blue sky has both a blue and green histogram “bump”
Also, note the clipped whites (indicated in red) in the smoke trails @ +2EV
How To Get A Correct Histogram | What Is ETTR
Okay, before we continue, we must caveat: there is no such thing as the “right” exposure, for reasons we discussed in our Official Guide on Exposure. Since every exposure has a histogram, the same rule applies- We’re going to use terms like “correct” and “right” histograms, however, creatively speaking there is always more than one way to expose an image. So, be sure to read that Official Guide on Exposure and especially check out the high-key and low-key sample images. Or, just scroll down to the next section, “Creative Use of Your Histogram”.
 Example of a “Low-Key” (mostly dark) Image & Histogram
(Notice that there is still a near-white highlight, too!)
With that said, now we will explain what a “correct” histogram looks like, if only from a technical perspective.
Here’s the traditional method when it comes to gauging your exposure by using your histogram: Expose To The Right, or, ETTR. The concept is to set your exposure so that the histogram’s graph is close to the right (white/highlight) edge of the histogram, instead of in the middle or towards the left (black/shadow) edge. Why? Because simply put, the brighter parts of an image offer better image quality. Highlights tend to be very smooth and noise-free, while deep, dark shadows tend to get more and more “noisy” especially when they’re boosted in post-production.
Put another way: As long as you don’t actually clip a highlight, then you’re generally better off shooting a bright exposure and darkening the image in post-production, instead of accidentally under-exposing the image and brightening it in post-production.
The critical step in the method of ETTR is, to expose the image as brightly as possible, without actually clipping any (important) highlights. To do this, it is important to carefully check your histogram, whether live or after clicking a photo.
Actually, it’s very useful to turn on your highlight clipping warning in-camera, which causes any clipped highlights to “blink” at you. On most cameras this feature is displayed using the grey, all-inclusive RGB histogram, however on some cameras, such as many Nikons, you can set the camera’s image playback to display clipped highlights for individual Red, Green, or Blue histograms.
In a red-hot sunset, for example, the Red channel will clip long before the G/B channels, and therefore the grey RGB histogram may not correctly show a clipping warning.
Creative Use Of Your Histogram
As we mentioned already, there is no such thing as one single “correct” exposure or histogram, due to the creative nature of photography of course.
In short, although it is true that practicing the ETTR method correctly will give you the absolute best possible image quality, you can still creatively expose a scene with great success. See High-Key and Low-Key in our glossary for more examples!
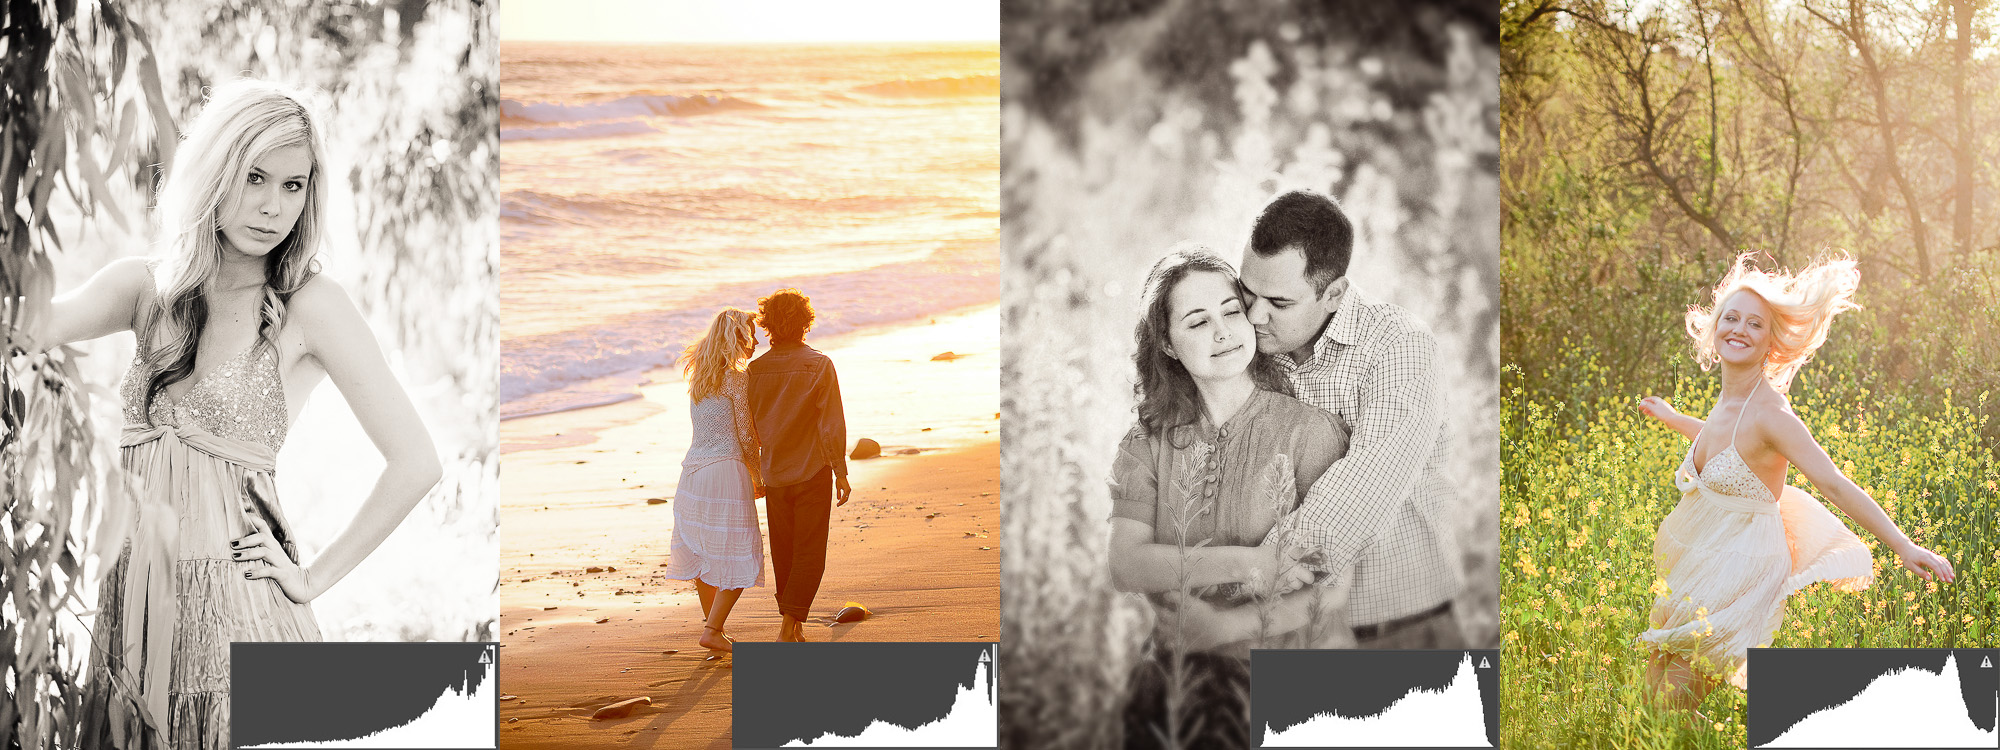 High-Key Images and their Histograms
 Low-Key Images and their Histograms
Technical Details About Your Histogram
You’re now a master of your histogram, congratulations! If you want, you can just grab your camera and head out to shoot some photos. However, if you’re interested in diving even deeper, and truly becoming a master of your in-camera histogram, here are a few more details about the histogram when viewed in-camera.
The In-Camera Histogram Is Not A RAW Histogram
Unfortunately, the histogram you see in your camera, whether during live view or after clicking a picture, is NOT actually the raw image data’s histogram. It is a histogram created from the JPG image which is created as a thumbnail for the raw image data, based on the in-camera processing settings.
 In-Camera JPG Histogram (Nikon View) versus Adobe Camera Raw
(The histograms appear similar, but are not quite identical)
The Vertical Lines On the Histogram Graph
Most cameras display their histogram with 3-4 vertical lines that break up the histogram data into 4-5 different chunks. A photographer might look at these lines, and for example say to themselves, “hmm, my image appears to be exactly 1 EV under-exposed!” So, they brighten their exposure by 1 EV and don’t think twice.

Unfortunately, this is usually not a precise representation of actual EVs. In fact, most digital cameras today have 10-12 or more EVs of total dynamic range. Also, to complicate matters further, as we already discussed: the raw image data itself will have a different histogram than the in-camera JPG histogram, especially when applying highlight and/or shadow recovery in the raw conversion.
Therefore, the smartest thing you can do is to test your camera to see exactly how a 1-EV adjustment looks on your in-camera histogram, and also, what it turns into when you get the image on the computer.
 Nikon D750, Tamron 90mm Macro
f/4, 1/2.5 sec, ISO 100
Related Articles to Histogram Definition
Simulate Window Light Photography with Off-Camera Flash
We’re going to show you how to spice up an ordinary portrait using off-camera flash to simulate window light photography.
How to Read a Histogram | Quick Reference1
In this article, we’ll explain how to “read” or understand a histogram, and how to use it both in the field and in Lightroom, so that you can choose the right exposure and produce the best image quality.
Elevate Your Wedding & Engagement Photography in 7 Steps | Foreground Elements & Special FX
In this article, we’re going to look at different ways to use foreground elements and special effects to make the most of your location and boost visual interest in your photos
The Histogram Does Not Stand Alone | 4 Tools For Judging Exposure & Color
Nailing exposure is absolutely foundational to good photography, but so often its value overlooked. Here are 4 tools to use to make sure you get it right.


Get Connected!